


SAQL (Salesforce Analytics Query Language) is a query language used in Salesforce CRM Analytics (formerly known as Einstein Analytics) to query and manipulate data in datasets.
Queries created or edited in the query editor have unique characteristics compared to other queries, like those queries created in the lens. Review the following tips for working with queries created in the query editor.
1. In the lens, create the chart by adding the measure and groupings (one for Bars and another for Bar Segments.
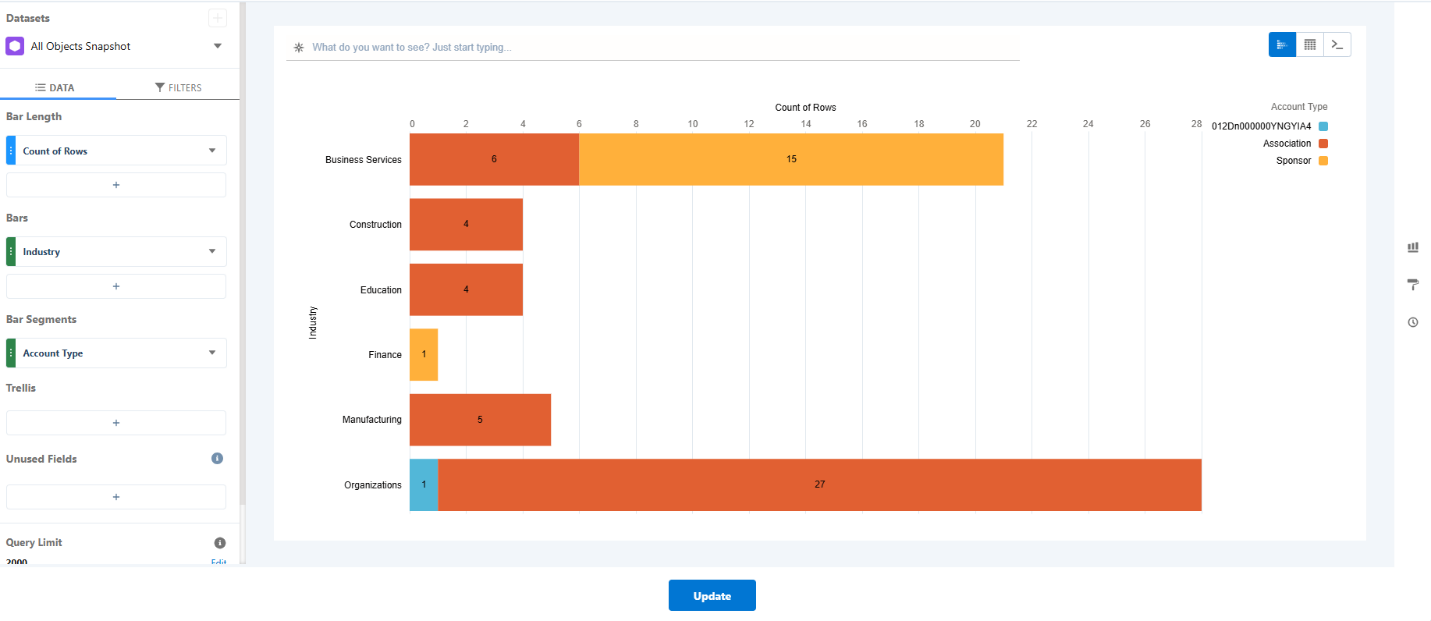
2. Click and select
 to switch to a compare table.
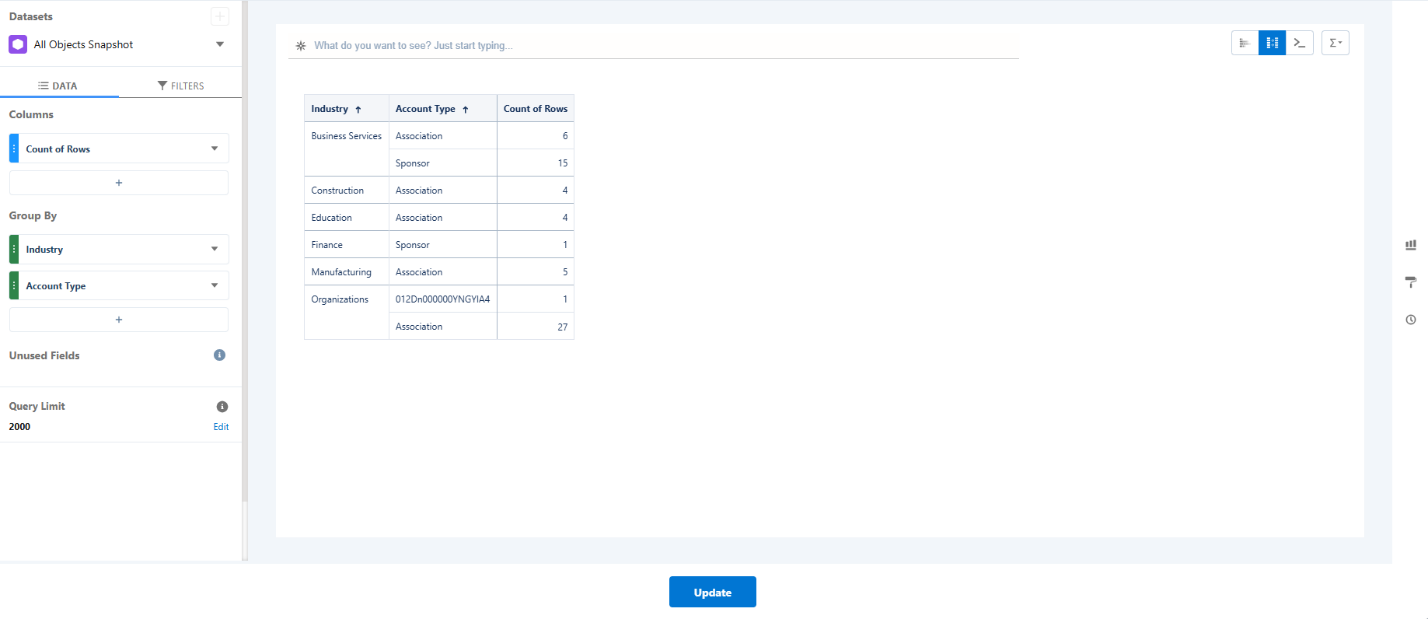
3. Add another Count of Rows measure by clicking + under Measures and then clicking Count | Rows. You’re going to total the values for all account types for each industry, and then sort based on that total using the windowing function.
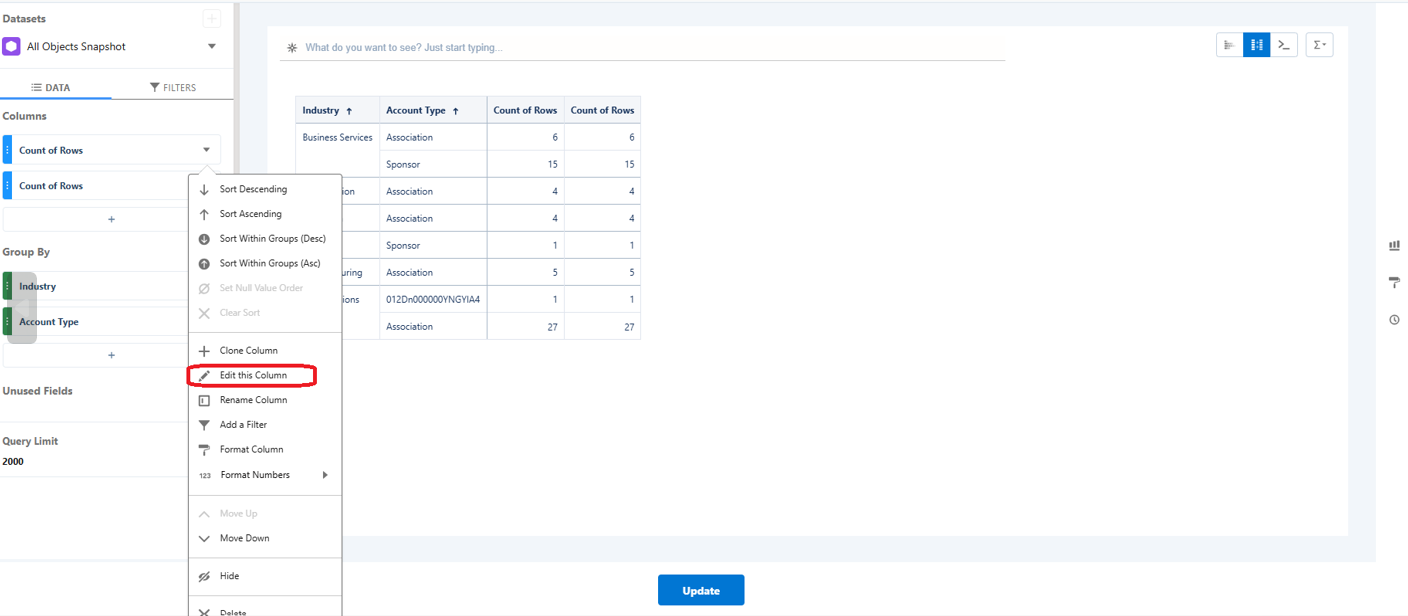
4. For the second “Count of Rows” measure, click the down arrow next to it and select “Edit this Column.”
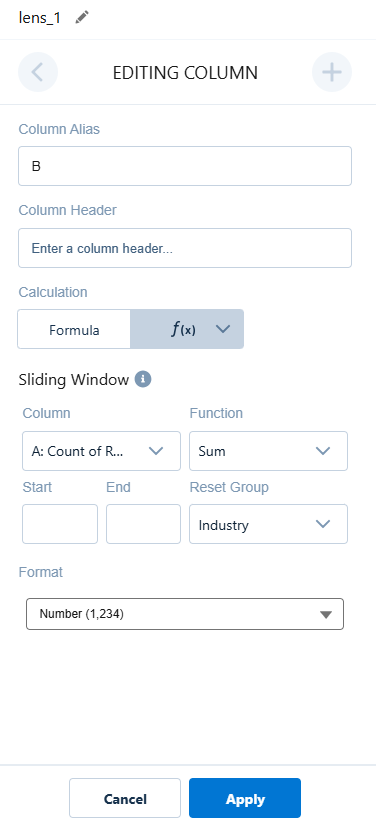
5. Select Sliding Window under Calculation, select Sum as the function, remove the start and end values for the window, select the Industry as the reset group, and then click Apply. This calculation combines the counts for both account types for each industry.
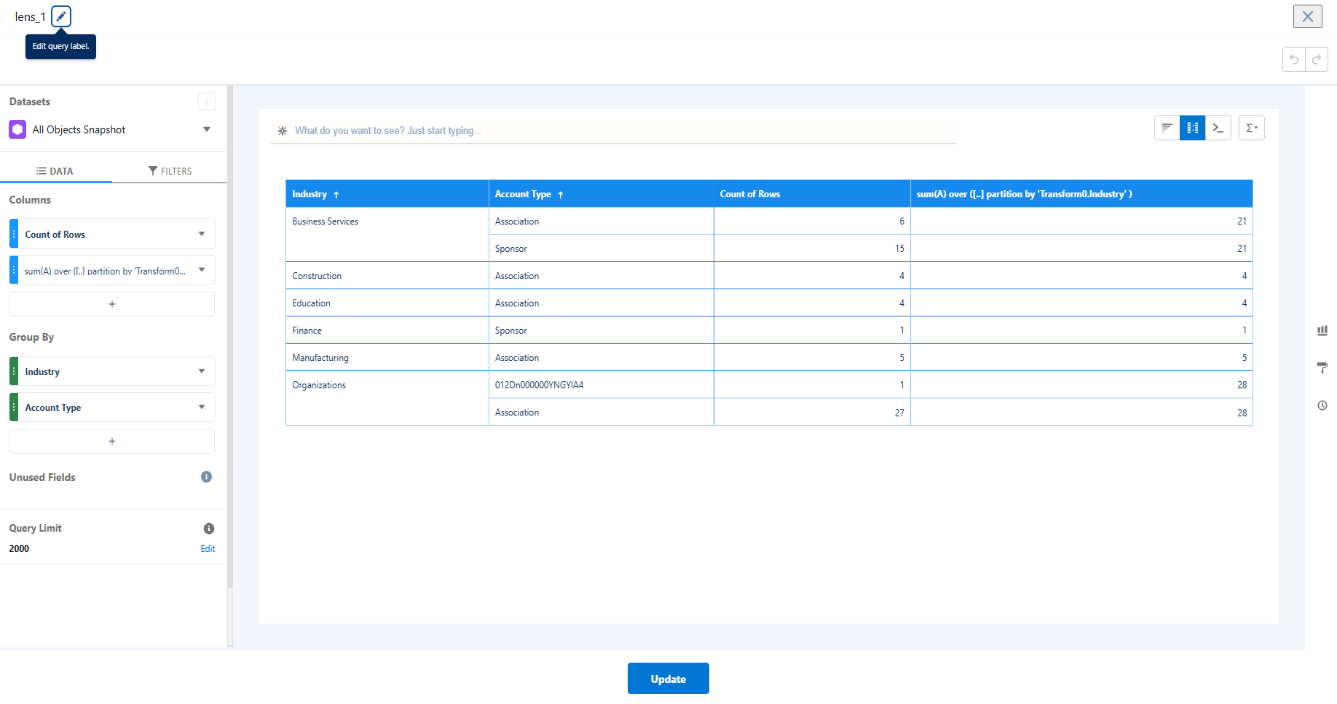
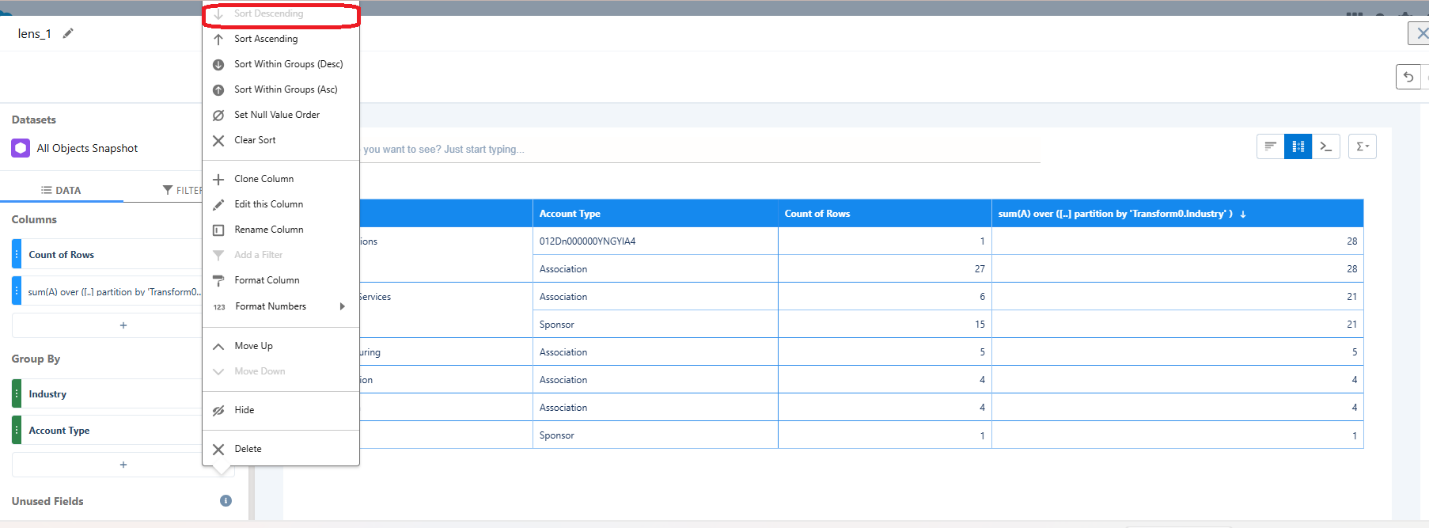
6. To sort the results based on this new total, select the dropdown arrow for this measure and select Sort Descending.
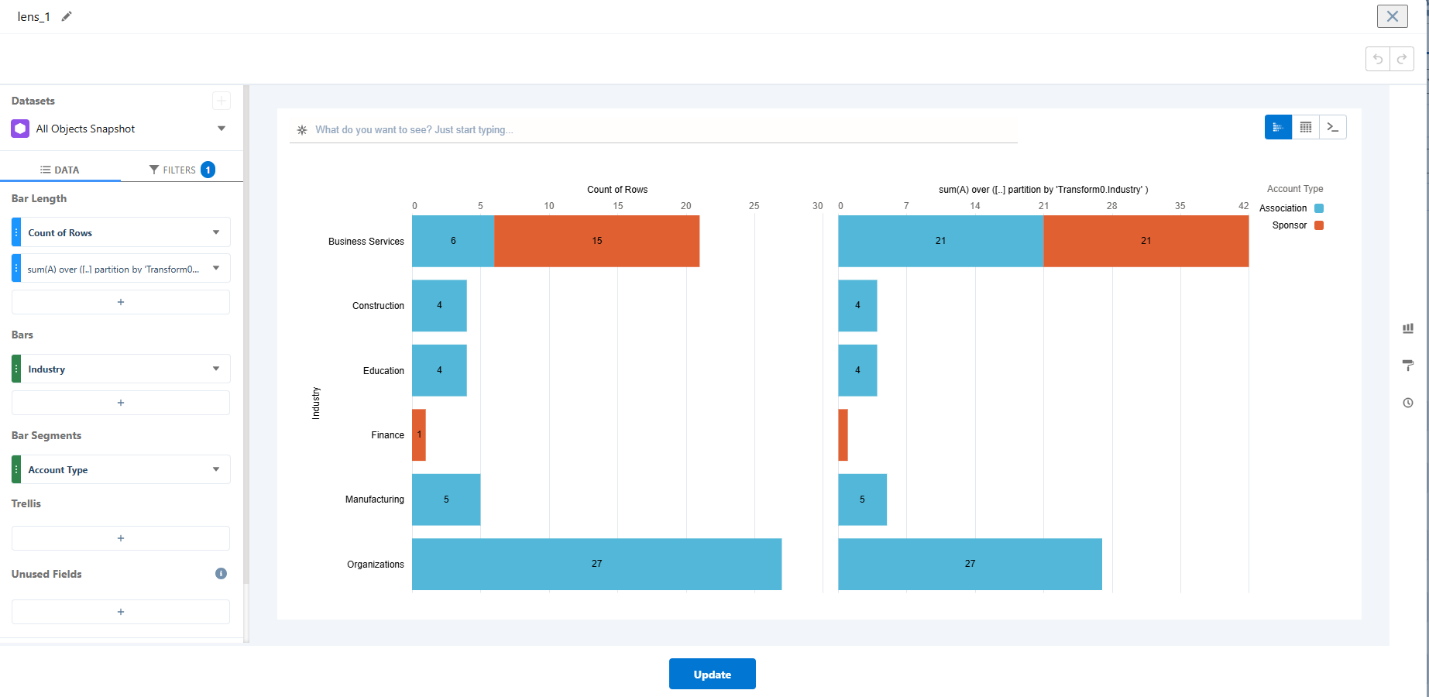
7. To view the results as a stacked bar or column chart, select  and select the chart.
When you view the query for the chart in the query editor, you see the following SAQL query.

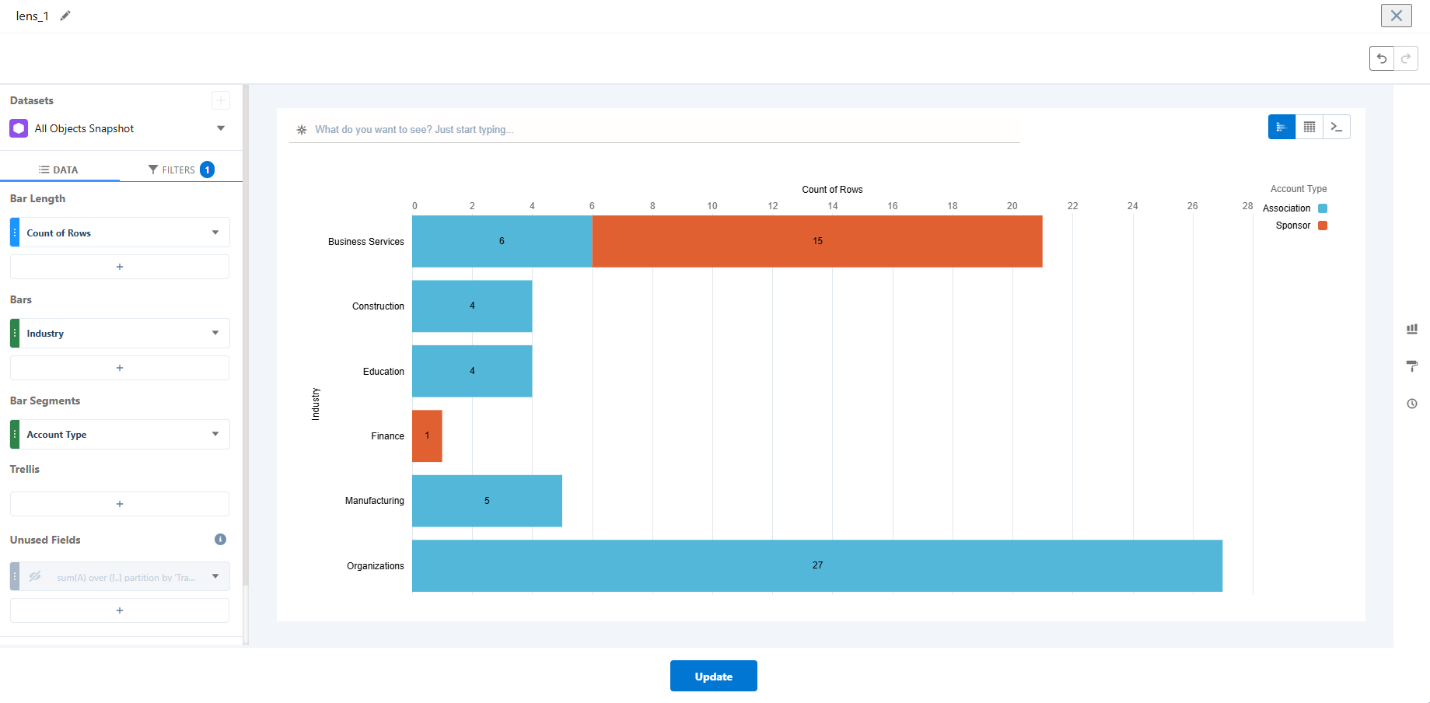
8. To hide the second measure that we created for sorting purposes, click the dropdown arrow for that measure, and then select Hide.
Final Tip
When editing SAQL, use Compare Tables for flexible calculations like window functions. Always hide helper columns that aren’t needed in the visualization.